
Back to Annual Meeting Program
The Effect of Surgeon's Specialty and Volume on Perioperative Outcome of Carotid Endarterectomy
Ali F AbuRahma, Mohit Srivastava, Stephen M. Hass, Albeir Y. Mousa, Patrick A. Stone, L. Scott Dean, John E. Campbell, Benny Y. Chong
Robert C. Byrd Health Sciences Center of W. Va. Univ., Charleston, WV
INTRODUCTION:
Several studies have demonstrated better outcomes for carotid endarterectomy (CEA) at high-volume hospitals and providers. However, only a few studies have reported on the impact of surgeons’ specialty and volume on the perioperative outcome of CEA.
METHODS:
This is a retrospective analysis of prospectively collected CEA data during a recent two-year period. Surgeons’ specialties were classified according to their Board specialties into: general surgeons (GS), cardiothoracic (CT), and vascular surgeons (VS). Surgeons’ annual volume was categorized into: low volume (<10 CEAs), medium volume (10-<30 CEAs), and high volume (≥30 CEAs). The primary outcome was 30-day perioperative stroke and/or death. Other perioperative complications were analyzed. Both univariate and multivariate analyses were done to predict the effect of specialty/volume and any other patient risk factors on stroke outcome.
RESULTS:
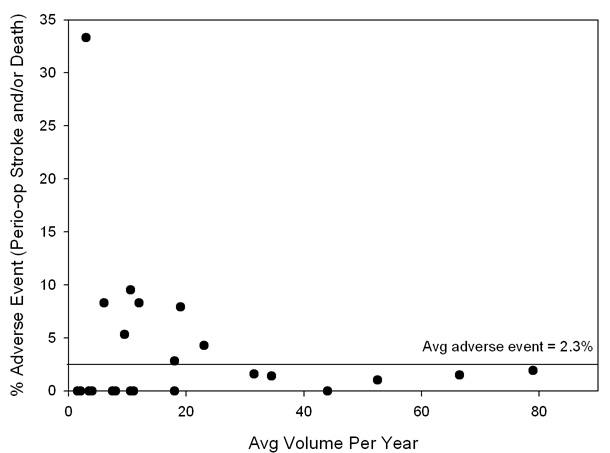
Nine hundred and fifty-three CEAs were performed by 24 surgeons: 122 by seven GS, 383 by 13 CT, and 448 by four VS. Patients’ demographics/clinical characteristics were similar between specialties, except the incidence of coronary artery disease, which was higher for CT (p<0.0001). The indications for CEA were symptomatic disease in 38% for VS, 31% for GS, and 23% for CT (p<0.0001). The perioperative stroke and death rates were 4.1%, 2.9%, and 1.3% for GS, CT, and VS, respectively (p=0.1263). A sub-group analysis showed that the perioperative stroke rates for symptomatic patients were 5.3%, 2.3%, and 2.3% (p=0.5112) and for asymptomatic patients were 3.6%, 3%, and 0.72% (p=0.0992) for GS, CT, and VS, respectively. Perioperative stroke rates were significantly higher for non-vascular surgeons (GS and CT combined) versus VS in asymptomatic patients (3.2% versus 0.72%, p=0.0333). Perioperative stroke/death was also significantly lower for high volume surgeons: 1.3% versus 4.1% and 4.3% for medium and low-volume surgeons (p=0.0194) (1.3% versus 4.15% for high versus low/medium combined, p=0.005, Figure). More CEAs were done for asymptomatic patients in the low/medium surgeons (78%) versus high volume surgeons (64%, p<0.0001) with a stroke rate of 4.6% for low/medium volume surgeons versus 0.51% for high volume surgeons (p=0.0005). A univariate logistic analysis showed that the odds ratio (OR) of having a perioperative stroke was 0.3 (95% confidence interval = 0.13-0.73, p=0.0079) for high-volume surgeons, 0.4 (p=0.0686) for VS, 0.2 (p=0.0004) when patching was used, and 2.6 (p=0.0521) for patients with preoperative renal insufficiency. A multivariate analysis showed that the OR of having a perioperative stroke for CT (versus VS group) was 1.8 (p=0.269), for GS 1.7 (p=0.407), low volume surgeons (versus high volume) 3.1 (p=0.073) medium volume surgeons 2.0 (p=0.197), and for patching 0.25 (p=0.013, Table).
CONCLUSIONS:
High-volume surgeons had significantly better perioperative stroke/death rates for CEA than low/medium-volume surgeons. Perioperative stroke/death rates were also higher for non-vascular surgeons, particularly in asymptomatic patients.
| Variable | Odds Ratio | 95% Confidence Interval | p value |
| Specialty CT versus VS | 1.8 | 0.64-4.98 | 0.269 |
| GS versus VS | 1.7 | 0.47-6.51 | 0.407 |
| Preoperative renal insufficiency | 2.4 | 0.89-6.25 | 0.083 |
| Patching | 0.2 | 0.07-0.62 | 0.005 |
| Volume Low versus high | 3.1 | 0.90-10.76 | 0.074 |
| Medium versus high | 2.0 | 0.70-5.76 | 0.197 |
| Preoperative renal insufficiency | 2.5 | 0.92-6.56 | 0.073 |
| Patching | 0.25 | 0.08-0.74 | 0.013 |
Back to Annual Meeting Program