
Back to 2015 Annual Meeting Abstracts
Volumetric Analysis of the Initial Index Computed Tomography (CT) Scan Can Predict the Natural History of Acute Uncomplicated Type B Dissections
Kedar S Lavingia, Sebastian Larion, S. Sadie Ahanchi, Chad Ammar, Mohit Bhasin, Aleem Mirza, Neil Reddy, David Dexter, Jean M Panneton
Eastern Virginia Medical School, Virginia Beach, VA
INTRODUCTION:
Our objective was to characterize the predictive impact of CT scan volumetric analysis on the natural history of acute uncomplicated type B aortic dissections (AD).
METHODS:
We conducted a retrospective review of patients with acute AD from 2009-2014 using TeraRecon iNtuition (TeraRecon, CA, USA). Volumes were obtained using the true lumen (TLV), false lumen (FLV), and total aortic volume (TAV) from the left subclavian artery to celiac artery. Growth rate was calculated as the change in maximal diameter between first and last available CT scan over the time interval. Differences in proportions were determined by ANOVA, chi square test or fisher exact test, as appropriate.
RESULTS:
During the study period, 164 patients had CT scan evidence of uncomplicated acute type B AD. 11 patients were excluded for lack of adequate imaging. 36 patients who underwent urgent repair (<14days) were also excluded. To assess natural history of disease, we evaluated a total of 117 patients: 85 patients who did not require intervention and 32 who underwent delayed TEVAR (29) or open repair (3) (>14days). Mean age was 66 ± 12, 57% were male, and 34% were black. Risk factors included 95% HTN, 29% CAD, 31% smokers and 27% diabetics. The mean time between initial and last imaging in follow up or before
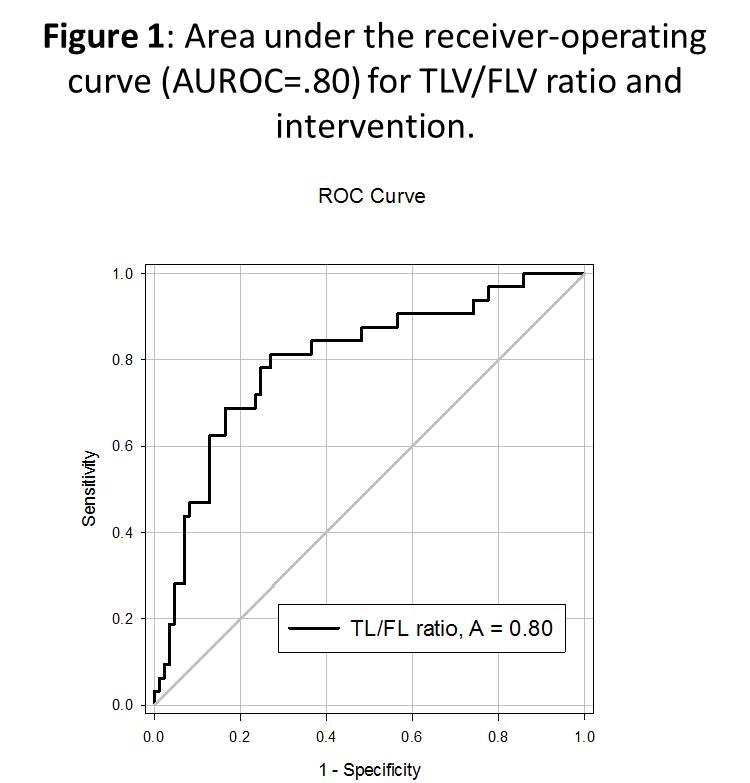
repair was 13 months. Mean time to operation was 23mo. Mean TLV/FLV ratio on initial CT scan was significantly higher in patients who did not eventually require an operation (1.55 vs .82, p=0.02). The mean growth rate was higher in those eventually requiring operation (2.47 vs .42 mm/mo, p=0.003). Patients were divided into 3 subgroups based on initial imaging TLV/FLV ratios ( <0.8, 0.8 - 1.6, and >1.6). There was a significant difference in the growth rates between these groups (4.6 vs. 2.4 vs. 0.8 mm/mo, p<.025). Area under the receiver-operating curve (AUROC) analysis revealed, a TLV/FLV ratio <0.8 was highly predictive for eventually requiring an intervention (area = 0.8; sensitivity = 69%; specificity = 84%: positive predictive value (PPV) = 71%; negative predictive value (NPV)= 81%), with an odds ratio of 12.2 (CI 5-26,
p<0.001). Conversely, a TLV/FLV ratio of >1.6 was highly predictive
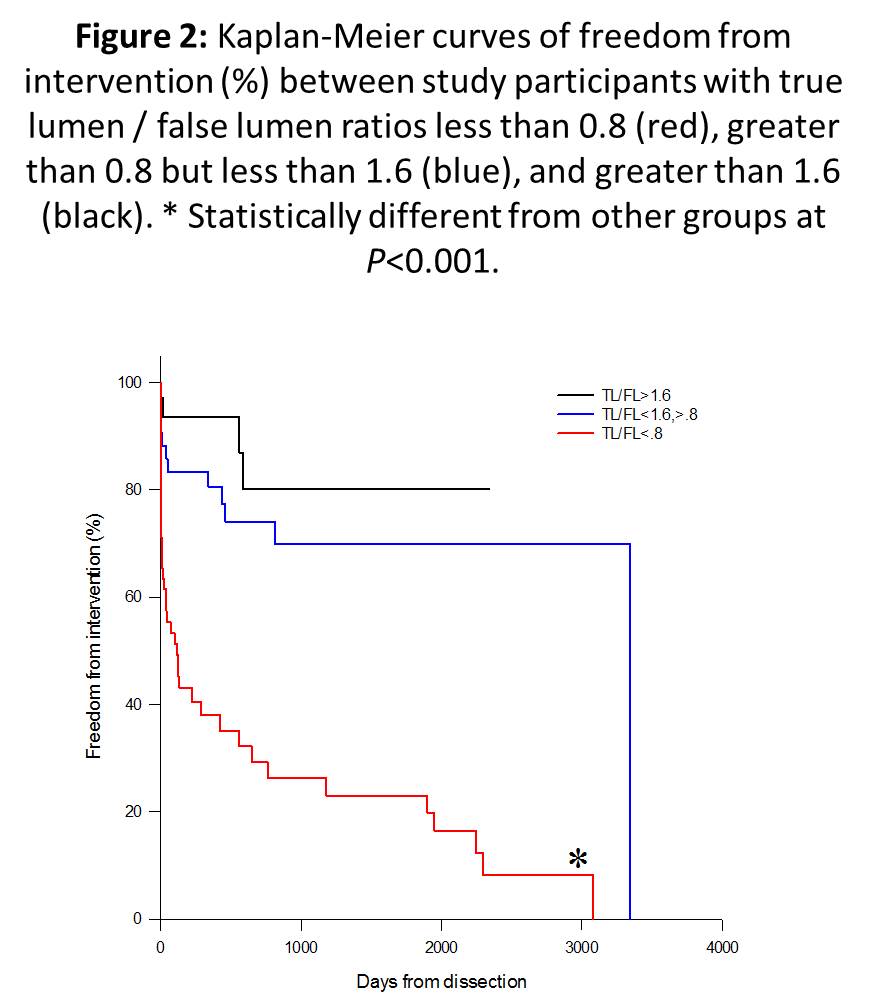
for freedom from late intervention (sensitivity = 91%; specificity = 42%; PPV = 61%; NPV = 86%)(Figure 1). After Kaplan Meier analysis, 1
year/2 year survival free of aortic interventions was 36%/26% with a TLV/FLV ratio <0.8, 81%/72% with a ratio 0.8-1.6 and 88%/80% with a ratio >1.6, p=0.001.
CONCLUSIONS:
CT scan volumetric analysis in patients with uncomplicated acute type B AD is a useful tool to predict the need for intervention. This may help select which patient with uncomplicated acute type B AD should undergo TEVAR preemptively.
Back to 2015 Annual Meeting Abstracts