
Back to 2015 Annual Meeting Abstracts
The Correlation between CT and Duplex Evaluation of Vein Bypass Grafts and their Relationship to Graft Failure
Jonathan Rehfuss, Yong He, Bradley Schmit, Peter Nelson, Scott Berceli, Salvatore Scali
University of Florida, Gainesville, FL
Background:
Infra-inguinal vein graft bypass, while often a successful treatment for lower extremity peripheral arterial disease, has five-year patency rates that range between 45 and 80% depending upon anatomic location and graft type. The optimal post-operative approach to graft surveillance for the purpose of identifying and repairing lesions which may lead to graft occlusion is not clear. The utility of routine duplex ultrasound (U/S) monitoring has been called into question by a multi-centered trial which demonstrated that such surveillance after venous femoral distal bypass grafts led to no significant clinical benefit or quality of life improvement at 18 months [1]. Current TASC II guidelines recommend a surveillance regimen consisting of routine physical exam, with pulse palpation and measurement of ankle-brachial indices, approximately every 6 months after graft placement without routine U/S evaluation.
Possibly confounding the clinical utility of duplex scanning is the potential disconnect between physiologic and anatomic methodologies. By its inherent nature, duplex scanning identifies regions of graft stenosis through local changes in blood velocity. Our laboratory, and others, have examined the complex flow patterns that are inherent in the tertiary structure of lower extremity vein graft and demonstrated marked variations in blood velocity that appear independent of a clearly defined anatomic stenosis. The current study was designed to systematically evaluate the relationship between physiologic (duplex scanning) and anatomic (CT scan) methodologies for assessment of vein graft stenosis and evaluate the relationship of these observed abnormalities to vein graft failure
Methods:
Fifty-four patients who underwent infra-inguinal autogenous vein graft bypass for disabling claudication or tissue loss between 2007 and 2012 at the Malcolm Randall Veterans Affairs Medical Center in Gainesville, Florida were included in our study. These patients were followed post-operatively for up to 5 years to monitor graft patency. This involved duplex U/S and CT imaging at intervals of 1 week, 1 month, 6 months and 12 months post-operation. U/S peak systolic velocity measurements were taken throughout the graft; generally one measurement was taken per “zone”. In the context of infra-inguinal bypass grafts, we divide the leg into 6 anatomic zones of equal length, corresponding to the proximal, middle and distal thigh and the proximal, middle and distal calf.
CT scan of the lower extremity graft was performed with intravenous contrast at 1 mm slice intervals. Acquired scans were analyzed using our previously published reconstruction algorithms [2]. Briefly, Amira (Visualization Sciences Group, Burlington, VA) was used to visualize the vein graft using an isosurface module below a threshold intensity value which is usually 100. The VolumeEdit module was used to remove all remaining non-graft structures. These altered images were then segmented in Vascular Modeling Toolkit (www.vmtk.org) based on a level set algorithm. The graft images were then further processed to obtain a smoother surface in Geomagic Studio (3D Systems, Rock Hill, SC). Next, the centerline of the graft was created using VMTK, and the areas of cross-sections orthogonal to this centerline were calculated at 1-mm intervals using a script written in Matlab (MathWorks, Inc., Natick, MA).
The reconstructed, CT-derived graft geometries across all times were co-registered and correlated with the six anatomic U/S zones previously described, and a maximum and mean lumen
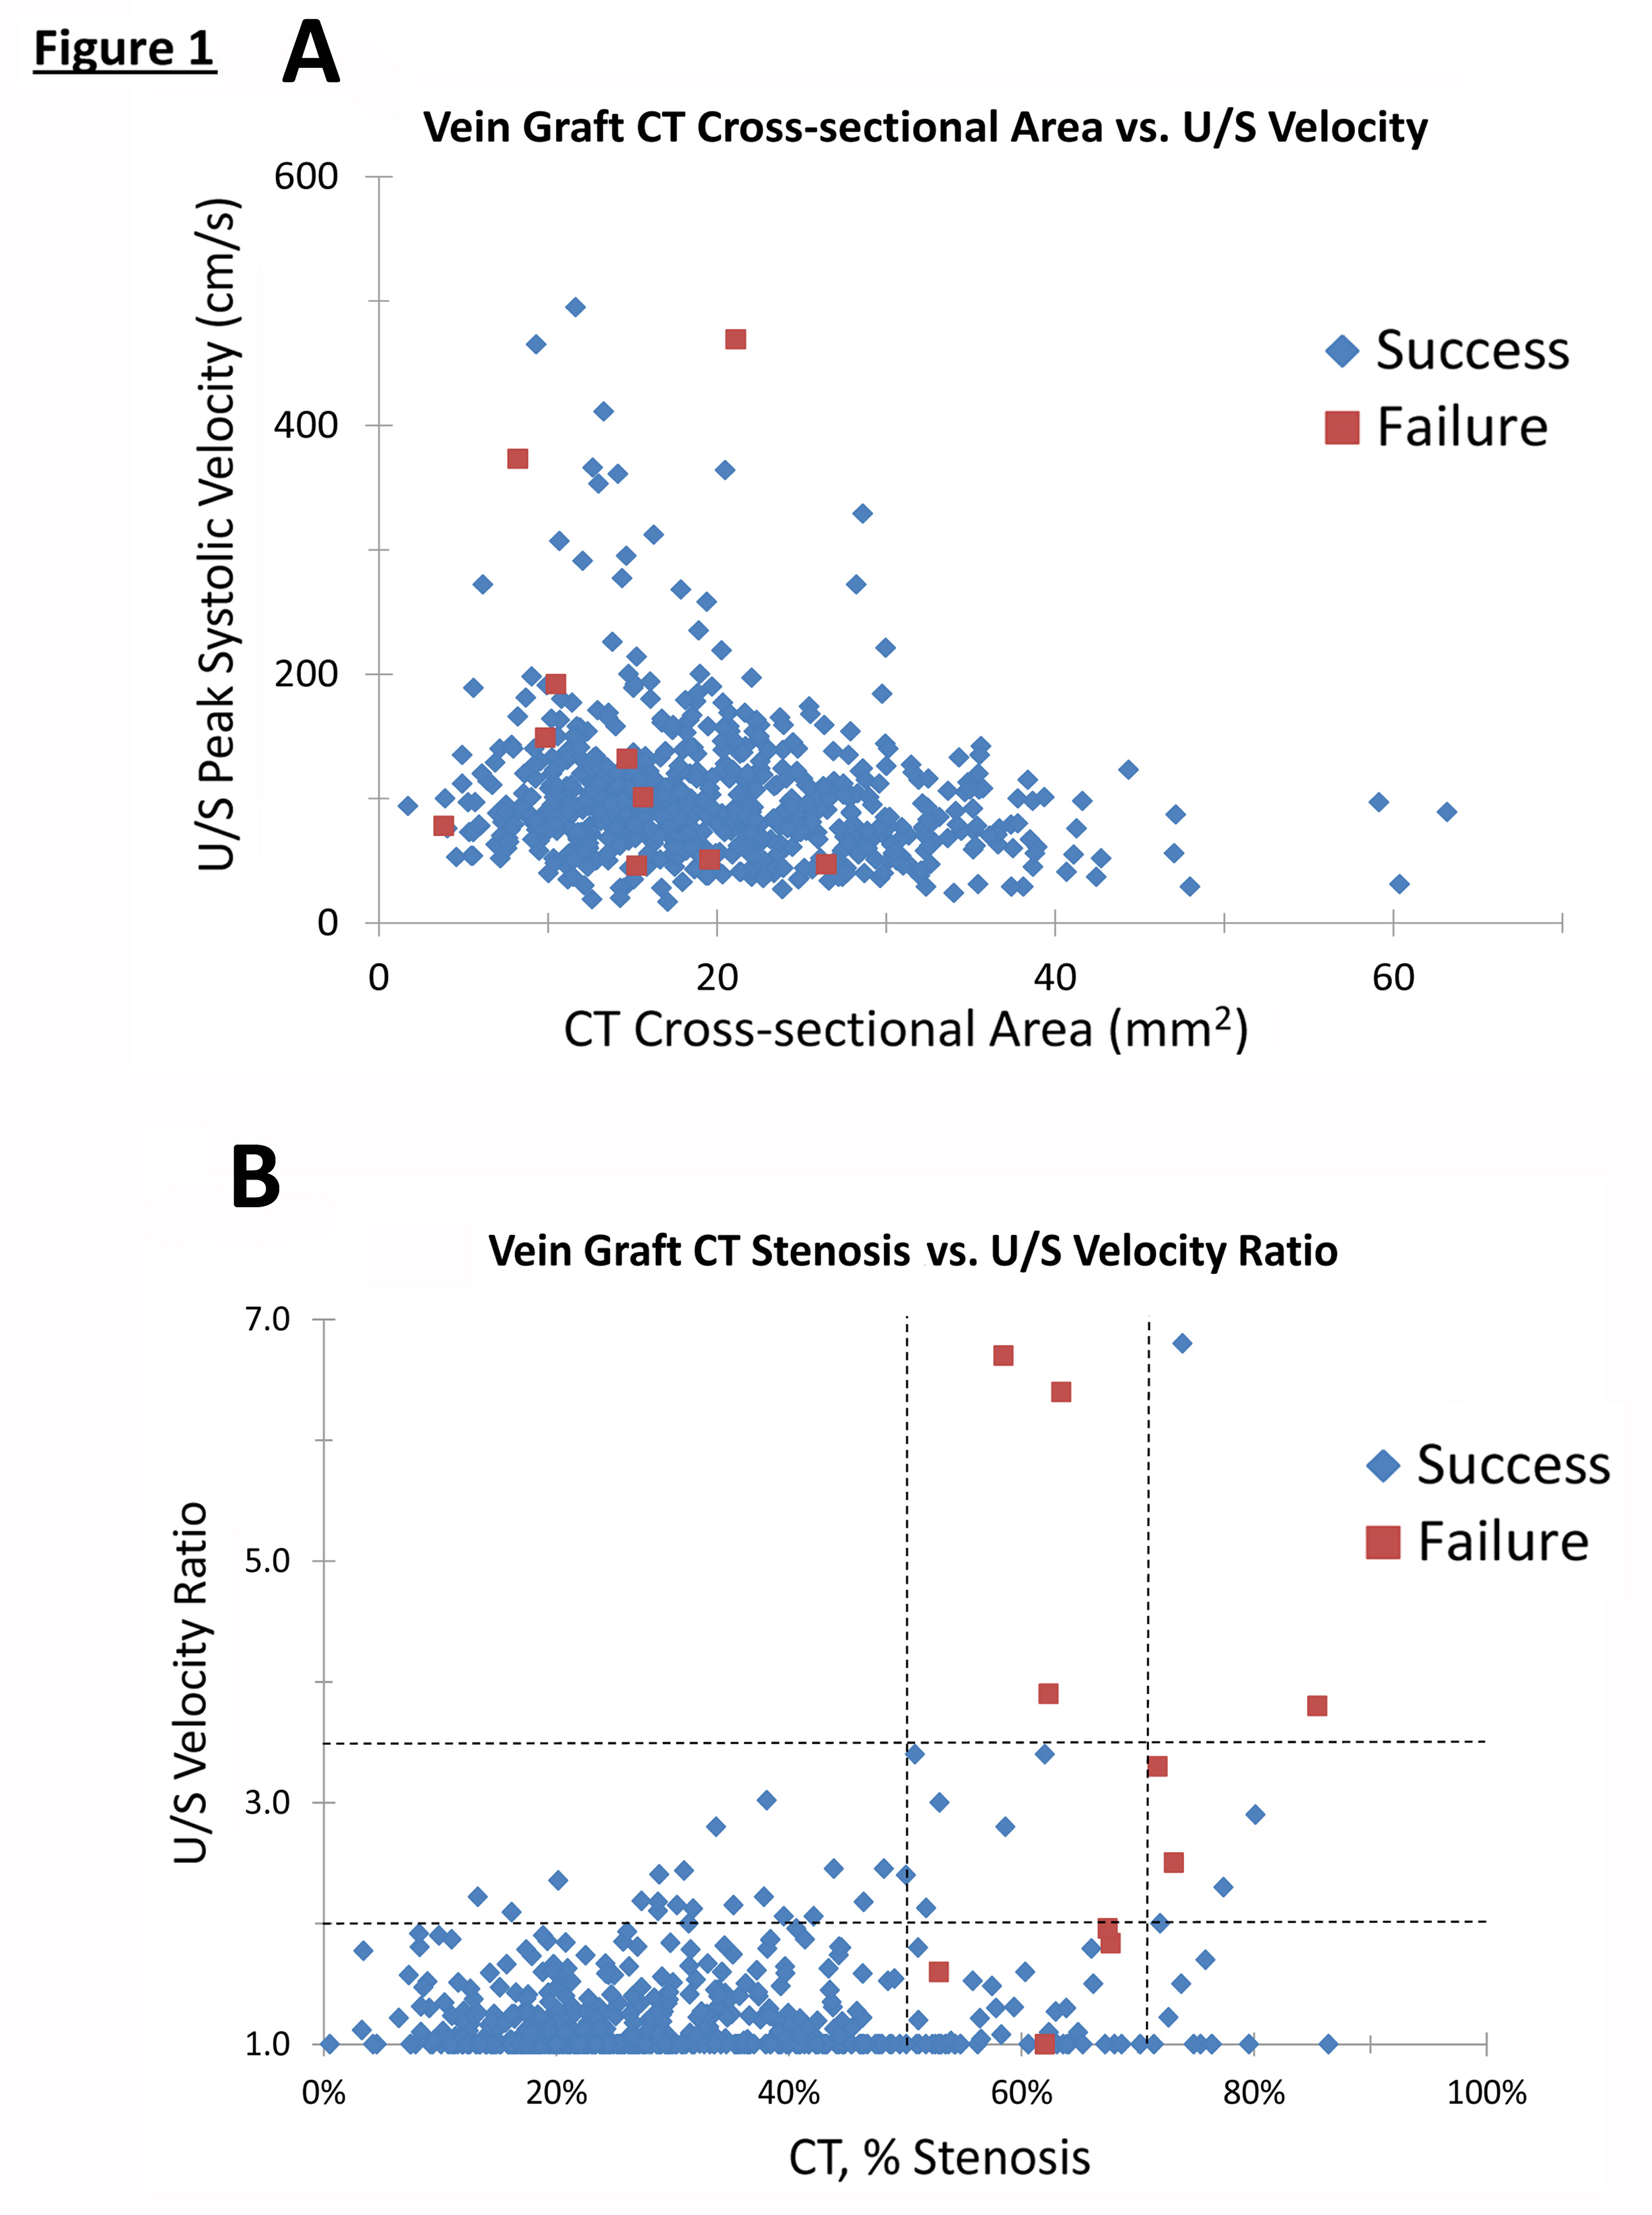
cross-sectional area for each zone was then determined. U/S velocity ratios were obtained using standardized interpretation criteria, defining a velocity ratio as the peak systolic velocity at a site of perceived stenosis normalized to the peak systolic velocity obtained with a uniform segment of graft. Thus, our working data set consisted of both an U/S velocity measurement and a CT cross-sectional area measurement for each zone per patient, at each of the four time points (1 week, 1 month, 6 months, 12 months) for a total of 653 patient*zone*time points (Figure 1A).
Results:
The correlation between CT cross-sectional area and U/S peak systolic velocity was evaluated by plotting each of these 653 pairs of values (Figure 1A). While a consistent inverse relationship between graft area and U/S velocity might be anticipated, only a weak correlation was identified (Spearman rank correlation coefficient = -0.19). Most notable was that those segments with either a small cross-sectional CT area or a low duplex velocity had highly variable corresponding velocity or area measurements, respectively.
To parallel the clinical approaches currently in use, we transformed our 653 of CT area and US velocity measurements into CT percent stenosis and U/S velocity ratios. Analysis was focused on those data sets with either an U/S velocity ratio > 2 (n = 24) or a CT stenosis > 50% (n = 76), since these findings would be most relevant to identify grafts at risk for failure. This yielded 83 unique points from 34 patients. Each of these points was adjudicated to be either a failure or a success, with failure being defined as a pathological change within that zone resulting in thrombosis or a re-intervention within the six month period following the time point. Ten of the 83 points from 8 different patients were deemed failures and 73 of the 83 points from 31 patients were deemed successes. Note that it is possible for a single patient to have both success and failure points at different regions within the same graft.
Each of the study’s 54 patients was placed into either the failure group (n=13) or the success group (n=41). Failure was defined as graft failure requiring re-intervention (n=8), amputation (n=1) or U/S demonstrating graft stenosis or occlusion without re-intervention (n=4). Importantly, twelve of the 13 patients in this failure group were included among the 34 patients who had either an increased U/S velocity ratio >2 or a CT stenosis > 50%, indicating that these parameters are quite sensitive for the detection of patients whose grafts do not remain patent.
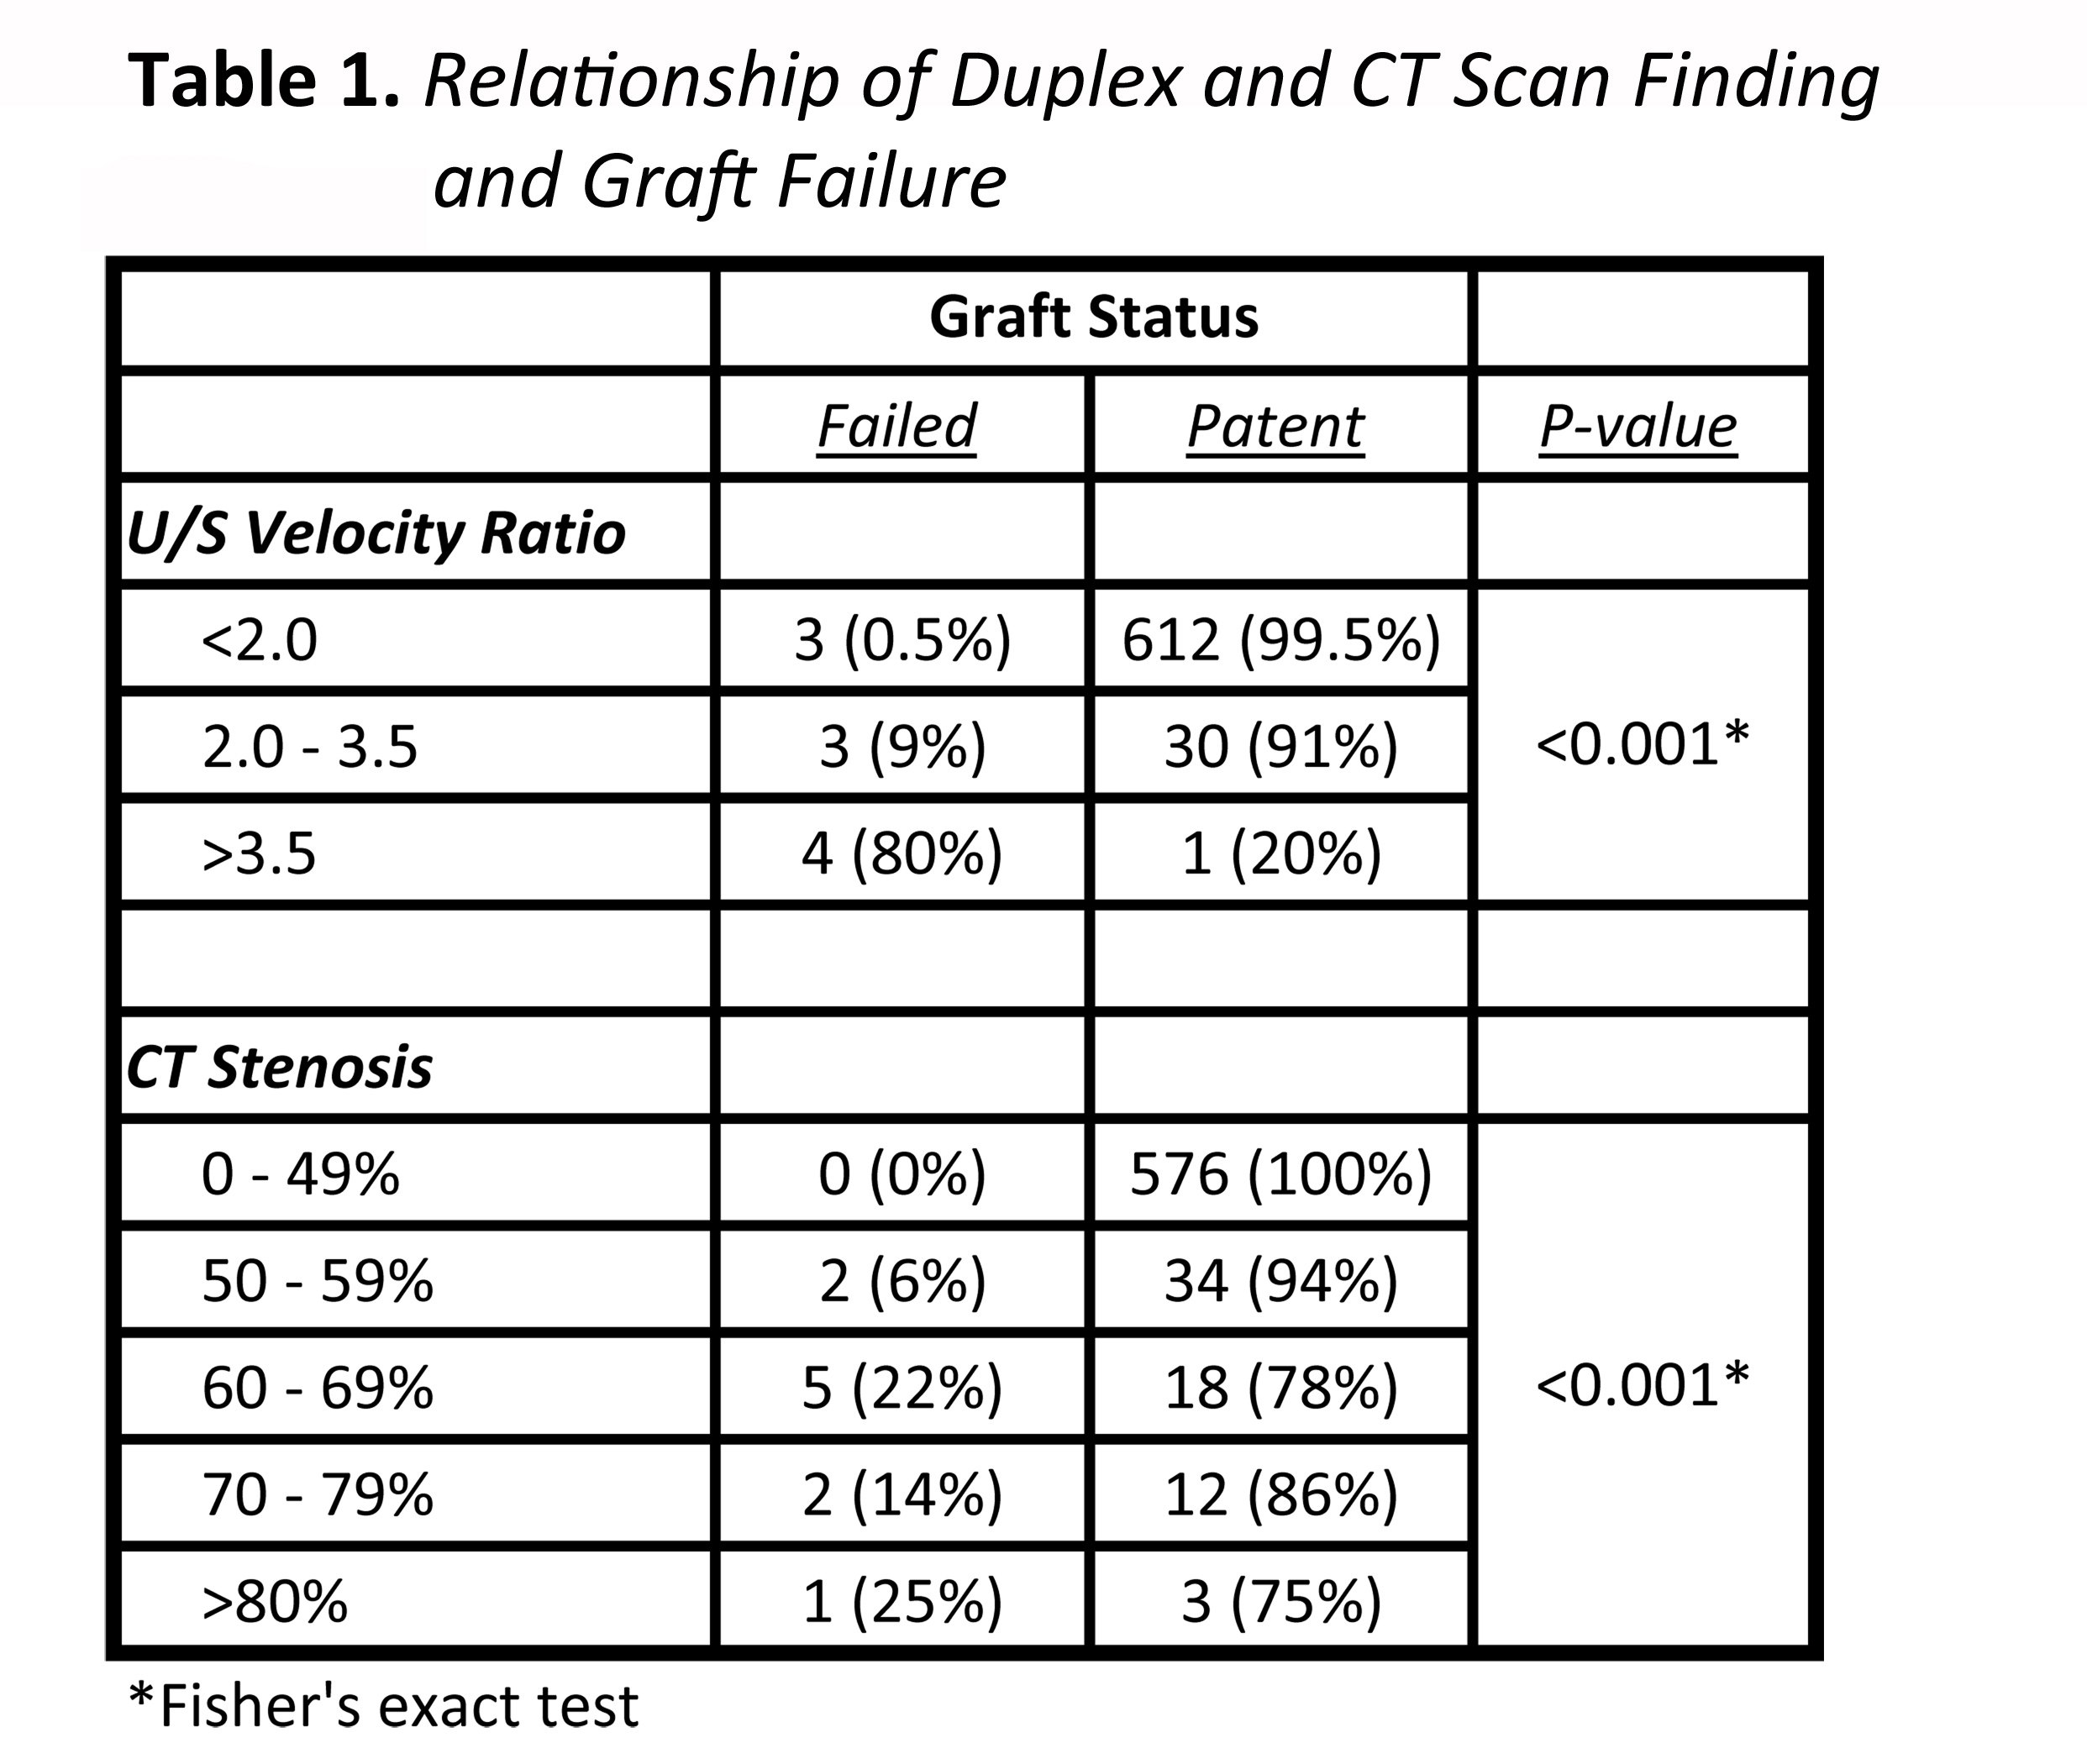
A CT stenosis less than 50% was extremely highly correlated with success (0% failure), while a velocity ratio > 3.5 was correlated with an 80% failure rate (Figures 1B, Table 1). Interestingly, even high degrees of CT-demonstrated stenosis were still more likely to succeed than not, with those in the >80% group having only a 25% failure rate (Table 1).
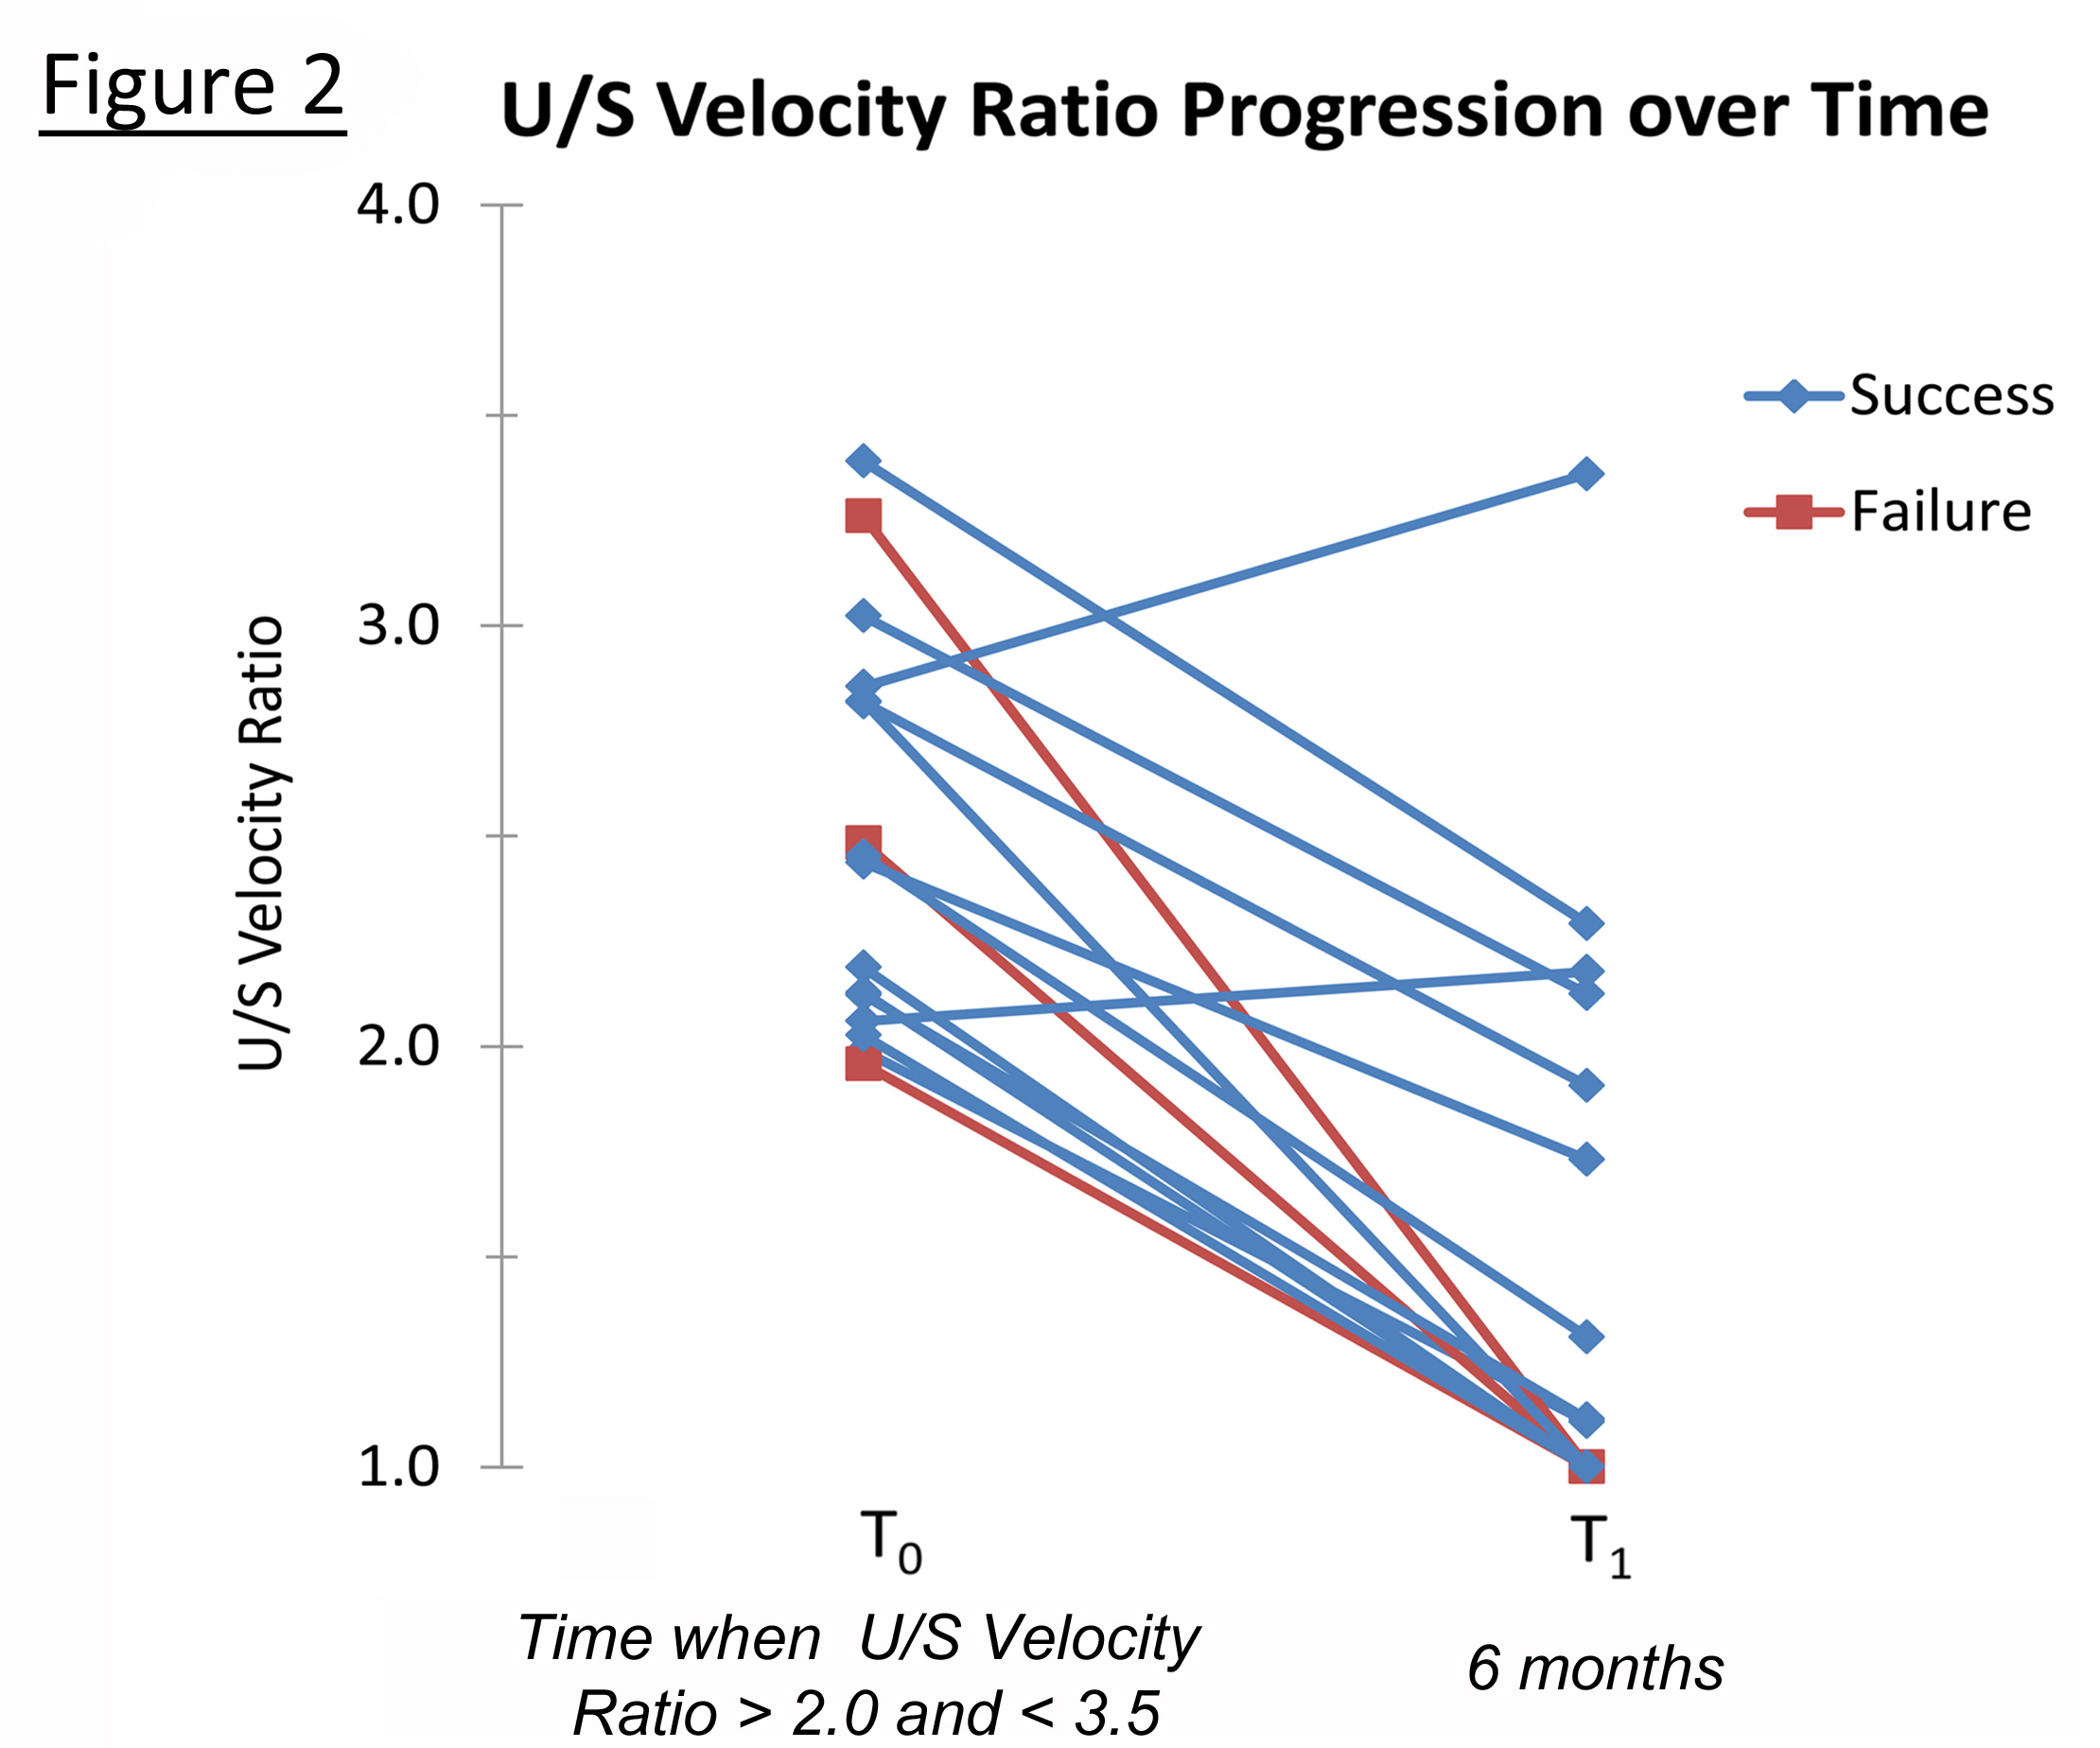
Among the most clinically pertinent questions relates to the natural history of a moderate graft stenosis, identified as a duplex-derived velocity ratio in the 2.0 to 3.5 range. Interesting, the current data demonstrates that this group tended to improve with a reduction in the velocity ratio over the next time interval (Figure 2). Fourteen of 16 grafts
(88%) in this moderate velocity range demonstrated a reduction in the U/S velocity ratio. Supporting the relatively benign nature of these lesions, modest U/S velocity ratio elevations in the 2 - 3.5 range were associated with only a 9% failure rate (Table 1). Interestingly, all three of the grafts that failed in this group had a reduction in velocity ratio, suggesting either a highly dynamic lesion with substantial plasticity or a technical scanning error in which the dominant lesion was not identified.
Conclusions:
The most effective approach to post-operative vein graft bypass surveillance is not universally agreed upon. Our analysis demonstrates that significantly elevated U/S velocity ratios > 3.5 are strongly correlated with graft failure and also that low and even moderate CT stenosis less than 80% strongly correlate with graft success. We demonstrate that a moderately elevated U/S velocity ratio in the 2 to 3.5 range is largely clinically benign, with few of these grafts ultimately failing and that velocity ratios for this group tend to improve with time. Finally, except in the case of either a very high U/S velocity or a large cross-sectional area, the expected inverse relationship between CT area and U/S velocity does not exist in our data set.
We have examined the data collected from two different types of studies, each of which evaluates the graft in a different manner (CT provides an anatomic assessment, while U/S offers a physiologic appraisal of function), and have begun the process of characterizing the relationship between these studies’ findings and the ultimate fate of a vein graft. A clear understanding of this relationship will likely contribute to the establishment of the optimal strategy for graft monitoring so that arising pathology can be appropriately identified and treated prior to graft failure.
1. Davies AH, Hawdon AJ, Sydes MR, Thompson SG. Is duplex surveillance of value after leg vein bypass grafting? Principal results of the Vein Graft Surveillance Randomised Trial (VGST). Circulation 2005; 112(13): 1985-91.
2. He Y, Terry CM, Nguyen C, Berceli SA, Shiu YT, Cheung AK. Serial analysis of lumen geometry and hemodynamics in human arteriovenous fistula for hemodialysis using magnetic resonance imaging and computational fluid dynamics. Journal of Biomechanics 2013; 46(2013): 165-169.
Back to 2015 Annual Meeting Abstracts