
Interstate Variation in Practice Patterns and Medicare Payments for Common Vascular Services in the Southern United States
William W Sheaffer, Andrew J Meltzer, Victor J Davila, William M Stone, Samuel R Money
Mayo Clinic Arizona, Phoenix, AZ
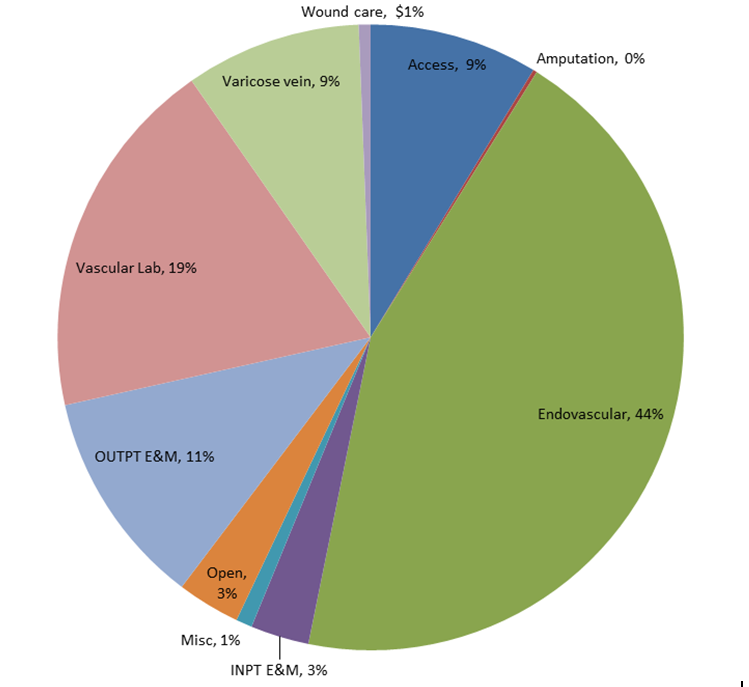
Background The shift from traditional, open vascular surgery to endovascular interventions has dramatically altered the practice of vascular surgery. The purpose of this study was to explore the implications of the “endovascular revolution” on the vascular surgery workforce, and characterize contemporary practice patterns and reimbursement for common vascular procedures in the Southern United States. Methods Vascular surgeons working in states represented by the Southern Association for Vascular Surgery (SAVS) were identified by NPI and practice location in the 2016 Medicare Physician Clinical Utilization Data file. All charges and payments to vascular surgeons for commonly performed (>10/year) services were identified by CPT code and stratified into 10 distinct categories (open, endovascular, access, amputation, varicose vein, wound care, outpatient E&M, inpatient E&M, vascular lab, and miscellaneous/non-vascular. Charges and payments for these commonly performed services were calculated at the provider, category, and state level to provide comparison. Statistical analysis including ANOVA, Control Chart analysis, and Fisher's Exact Test were utilized to compare payments and charge:payment ratios. Results In 2016, 1052 vascular surgeons received $247M for commonly performed vascular surgery services. Amongst all CPT categories, endovascular procedures accounted for the greatest proportion of all payments ($109M, 44%) compared to open vascular procedures accounting for only 3% ($8M). Vascular lab services ($46M, 19%), varicose vein treatments ($22M, 9%), access procedures ($21.5, 9%), and wound care ($22, 9%) were also of significant contribution. Evaluation and management charges accounted for 14% of payments (outpatient 11%, $28M, inpatient 3%, $7M). (Figure 1) Physician payments from Medicare ranged from $95.00-$6.2M (mean $250,042, SD $254,248). At the state level there was significant variation in practice patterns, payments per treated beneficiary (p < 0.001) and charge:payment ratio (p < 0.001 for all comparisons). Maryland had the highest payments per treated beneficiary: 5.5-fold greater than Arkansas (Figure 2a). There was greater than 2-fold variation in charge:payment ratio as well, with the highest charges: payments in Mississippi, Georgia, and North Carolina (Figure 2b). Conclusion Open vascular reconstruction now accounts for a small fraction of Medicare payments to vascular surgeons, in comparison to endovascular services and payments for noninvasive studies. While the significant variation in practice patterns, and medicare payments, at the provider level are to be expected, significant disparities in payments per beneficiary treated and charge: payment ratio persist at the state level. This overview of contemporary vascular practice in SAVS states highlights the financial impact of the endovascular revolution, as well as the significant variation in vascular care delivery and reimbursement in the region.

Back to 2019 Posters